Every XER.
Every insight.
Parse every XER, simulate every risk, scrub every schedule, and roll it all up in one workspace your project controls, executive, and client teams actually share.
One platform. Six core modules.
Every module reads the same XER. Every insight connects back to the same project. No re-importing, no copy-paste.
From raw XER to full insight in three steps.
Built for project controls. Built for everyone else too.
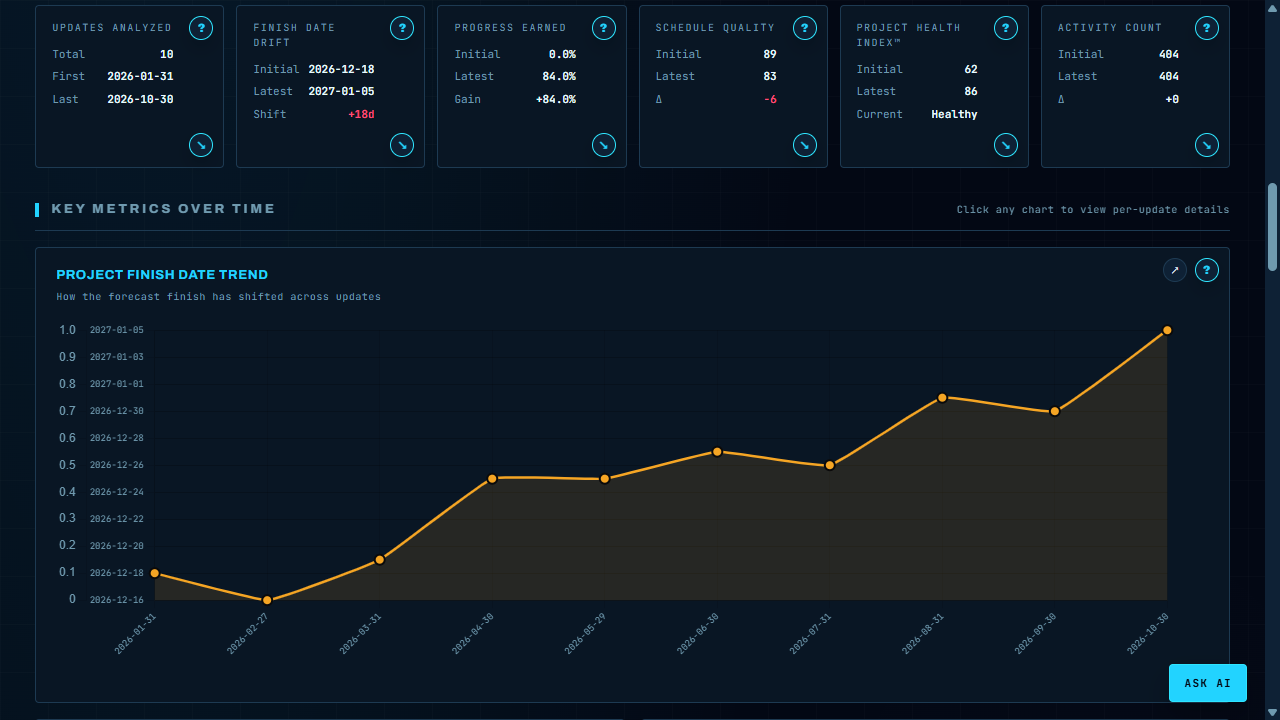
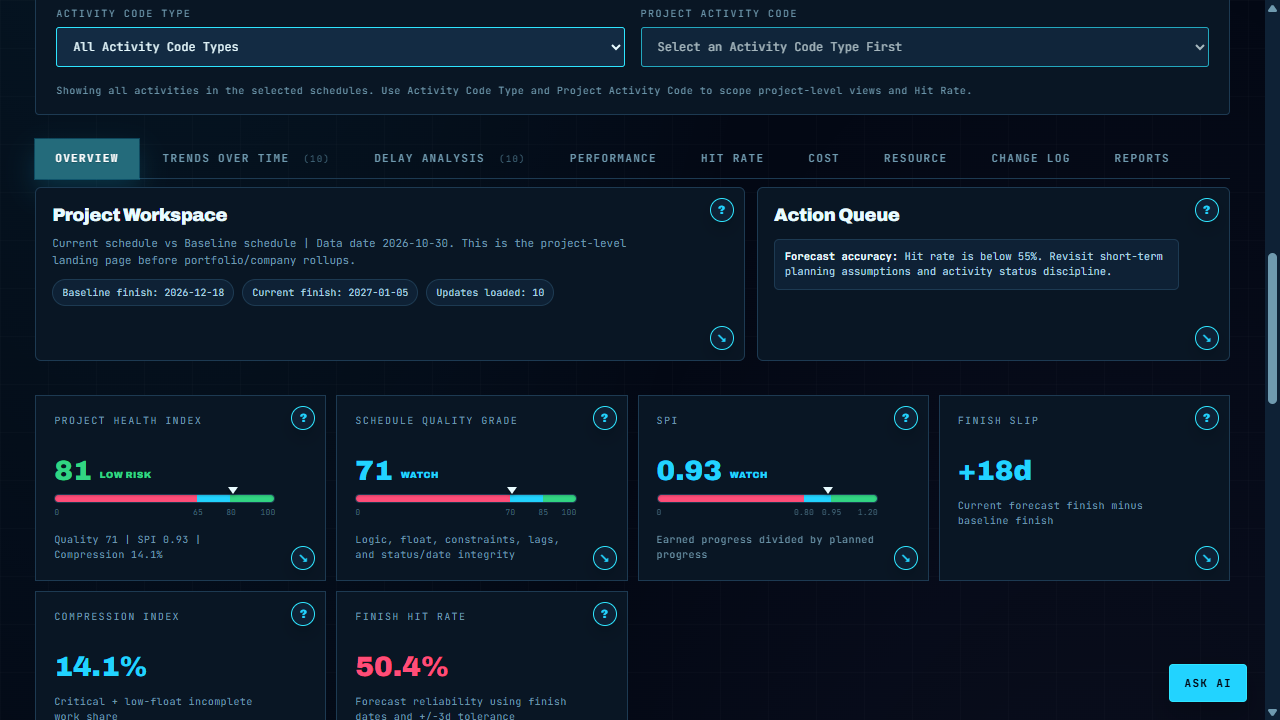
Every KPI. Every update. Every trend.
The analytics engine parses your full schedule history. Each XER upload becomes a data point, so teams can watch progress, SPI, float erosion, and delay movement across time.
- Full multi-schedule history loaded into one analysis
- Delay bridge, trends, and performance drilldowns
- Activity count and critical path tracking
- Schedule health, quality, and compression views

Turn dense CPM detail into a clean exhibit.
Build owner-ready summary schedules from schedule data, then tune the canvas, labels, lanes, milestones, and export format without leaving the workspace.
- Interactive executive summary canvas
- Starter layouts and schedule loading workflow
- Auto-label cleanup for presentation output
- PDF, PNG, SVG, JSON, and CSV export paths

Turn CPM activities into field-ready weekly updates.
Use the parsed project schedule to create a weekly plan, filter large activity sets by P6 activity codes, generate email requests, review responses, and export accepted updates back toward P6.
- Project-backed schedule selector with no re-import step
- Activity-code filters for large schedules
- Email request generator for responsible parties
- Remaining-duration updates with scheduler approval

Package the schedule story without rebuilding it by hand.
Choose a report template, assemble sections, pull saved views from the schedule modules, draft the narrative, and export a browser-printable package tied to the same parsed schedules.
- Executive, delay, performance, owner, weekly, and custom templates
- Toggleable report outline with reorderable sections
- Visual library for KPI cards, period bridges, S-curves, and Gantt windows
- HTML and JSON package exports

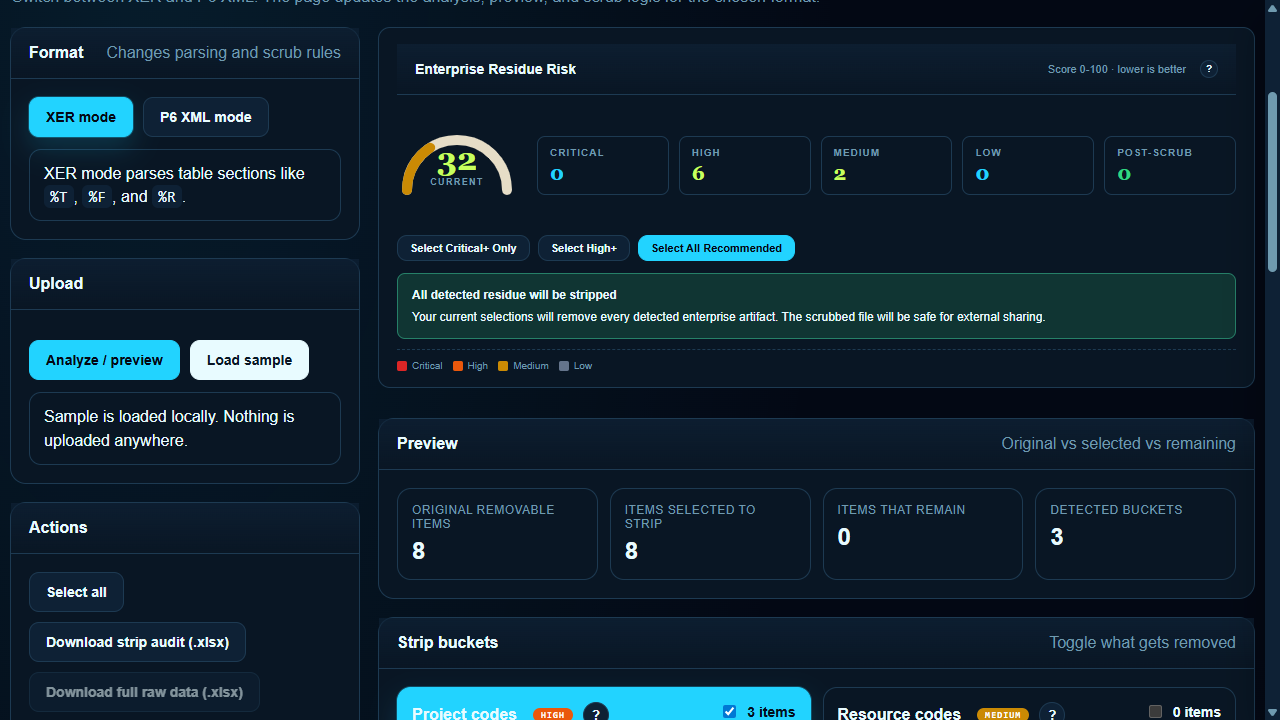
Risk numbers your client will actually believe.
Feed in activity-level risk estimates, run 10,000 iterations server-side, and get P50/P80 completion dates with a finish-date risk curve without a separate risk tool.
- 10,000 simulation iterations
- Editable duration bands and discrete risk events
- P50 and P80 date outputs
- Finish-date risk curve and burn-down trend

Serious analytics. Serious throughput.
One workspace. Every stakeholder.
Request workspace access.
We will follow up by email.
Tell us who should be added and which company or project team you are with. Approved users receive an invited account for the hosted workspace.